
Page 33 - Transformation Report 2021
P. 33
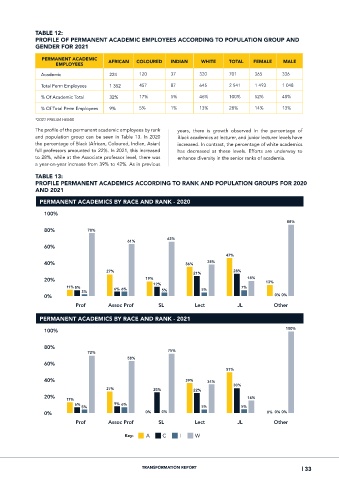
TABLE 12:
             PROFILE OF PERMANENT ACADEMIC EMPLOYEES ACCORDING TO POPULATION GROUP AND
             GENDER FOR 2021
                PERMANENT ACADEMIC
                     EMPLOYEES         AFRICAN   COLOURED    INDIAN     WHITE    TOTAL    FEMALE    MALE
               Academic                224        120        37        320       701      365       336
               Total Perm Employees    1 352      457        87        645       2 541    1 493     1 048

               % Of Academic Total     32%        17%        5%        46%       100%     52%       48%
               % Of Total Perm Employees  9%      5%         1%        13%       28%      14%       13%

             *2021 PRELIM HEMIS
             The profile of the permanent academic employees by rank   years,  there  is  growth  observed  in  the  percentage  of
             and population group can be seen in Table 13. In 2020   Black academics at lecturer, and junior lecturer levels have
             the percentage of Black (African, Coloured, Indian, Asian)   increased. In contrast, the percentage of white academics
             full professors amounted to 22%. In 2021, this increased   has  decreased  at  these  levels.  Efforts  are  underway  to
             to 28%, while at the Associate professor level, there was   enhance diversity in the senior ranks of academia.
             a year-on-year increase from 39% to 42%. As in previous
             TABLE 13:
             PROFILE PERMANENT ACADEMICS ACCORDING TO RANK AND POPULATION GROUPS FOR 2020
             AND 2021

               PERMANENT ACADEMICS BY RACE AND RANK - 2020
                 100%
                                                                                                      88%
                 80%            78%
                                                            63%
                                              61%
                 60%
                                                                                47%
                 40%                                              36%     38%
                                      27%                                          28%
                                                                     21%
                 20%                                19%                                 18%   13%
                                                       12%
                        11% 8%           6% 6%                          5%            7%
                              3%                          5%
                 0%                                                                              0% 0%
                            Prof           Assoc Prof                SL              Lect               JL            Other

               PERMANENT ACADEMICS BY RACE AND RANK - 2021

                                                                                                     100%
                 100%

                 80%
                                72%                         75%
                                              58%
                 60%
                                                                                51%
                 40%                                              39%     34%
                                                                                   30%
                                      27%              25%           22%
                 20%                                                                    14%
                        17%
                           6%            9% 6%
                              5%                                        5%            5%
                 0%                                 0%    0%                                   0% 0% 0%
                            Prof           Assoc Prof                SL              Lect               JL            Other

                                             Key:   A         C          I          W


                                                   TRANSFORMATION REPORT                                   | 33