
Page 69 - Transformation Report
P. 69
sources of water (new water, borehole water, rainwater, greywater, etc.), over the next five years, to 30% of our current water
usage. The long-term aim is ultimately to diversify the University’s water sources with less direct reliance on municipal water
provision.
Water usage across the University is uneven, with North/South Campus accounting for 80% of the University’s water usage, while
sport and its various activities utilise approximately 20%. Our residences are using water sparingly. It is therefore imperative
that each new building design and renovation should take into account the need for and ability to use diverse water sources
as part of its design. This will result in cost-saving since there is a significant difference in the cost of Return Effluent compared
to potable municipal water.
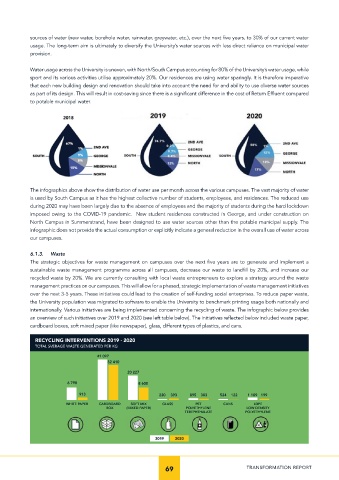
The infographics above show the distribution of water use per month across the various campuses. The vast majority of water
is used by South Campus as it has the highest collective number of students, employees, and residences. The reduced use
during 2020 may have been largely due to the absence of employees and the majority of students during the hard lockdown
imposed owing to the COVID-19 pandemic. New student residences constructed in George, and under construction on
North Campus in Summerstrand, have been designed to use water sources other than the potable municipal supply. The
infographic does not provide the actual consumption or explicitly indicate a general reduction in the overall use of water across
our campuses.
6.1.3. Waste
The strategic objectives for waste management on campuses over the next five years are to generate and implement a
sustainable waste management programme across all campuses, decrease our waste to landfill by 20%, and increase our
recycled waste by 20%. We are currently consulting with local waste entrepreneurs to explore a strategy around the waste
management practices on our campuses. This will allow for a phased, strategic implementation of waste management initiatives
over the next 3-5 years. These initiatives could lead to the creation of self-funding social enterprises. To reduce paper waste,
the University population was migrated to software to enable the University to benchmark printing usage both nationally and
internationally. Various initiatives are being implemented concerning the recycling of waste. The infographic below provides
an overview of such initiatives over 2019 and 2020 (see left table below). The initiatives reflected below included waste paper,
cardboard boxes, soft mixed paper (like newspaper), glass, different types of plastics, and cans.
RECYCLING INTERVENTIONS 2019 - 2020
TOTAL SVERAGE WASTE GENERATED PER KG
41 097
32 410
20 227
6 798 8 600
913 220 393 895 303 524 122 1 189 199
WHITE PAPER CARDBOARD SOFT MIX GLASS PET CANS LDPE
BOX (MIXED PAPER) POLYETHYLENE LOW DENSITY
TEREPHTHALATE POLYETHYLENE
2019 2020
69 TRANSFORMATION REPORT