
Page 19 - Transformation Report 2021
P. 19
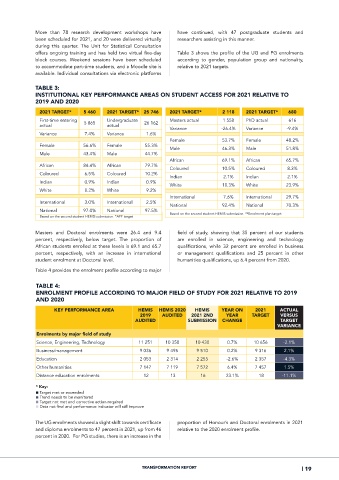
More  than  78  research  development  workshops  have   have  continued,  with  47  postgraduate  students  and
             been scheduled for 2021, and 20 were delivered virtually   researchers assisting in this manner.
             during  this  quarter.  The  Unit  for  Statistical  Consultation
             offers ongoing training and has held two virtual five-day   Table 3 shows the profile of the UG and PG enrolments
             block  courses.  Weekend  sessions  have  been  scheduled   according  to  gender,  population  group  and  nationality,
             to accommodate part-time students, and a Moodle site is   relative to 2021 targets.
             available. Individual consultations via electronic platforms

             TABLE 3:
             INSTITUTIONAL KEY PERFORMANCE AREAS ON STUDENT ACCESS FOR 2021 RELATIVE TO
             2019 AND 2020
               2021 TARGET*   5 460    2021 TARGET*  25 746  2021 TARGET*      2 118   2021 TARGET*   680
               First-time entering     Undergraduate         Masters actual    1 558   PhD actual     616
               actual          5 865   actual       26 162
                                                             Variance          -26.4%  Variance       -9.4%
               Variance        7.4%    Variance     1.6%
                                                             Female            53.7%   Female         48.2%
               Female         56.6%    Female       55.3%
                                                             Male              46.3%   Male           51.8%
               Male           43.4%    Male         44.7%
                                                             African           69.1%   African        65.7%
               African        84.4%    African      79.7%
                                                             Coloured          10.5%   Coloured       8.3%
               Coloured        6.5%    Coloured     10.2%
                                                             Indian            2.1%    Indian         2.1%
               Indian          0.9%    Indian       0.9%
                                                             White             18.3%   White          23.9%
               White           8.2%    White        9.2%
                                                             International     7.6%    International  29.7%
               International   3.0%    International  2.5%
                                                             National          92.4%   National       70.3%
               National       97.0%    National     97.5%
               Based on the second student HEMIS submission. *APP target  Based on the second student HEMIS submission. **Enrolment plan target

             Masters  and  Doctoral  enrolments  were  26.4  and  9.4   field  of  study,  showing  that  35  percent  of  our  students
             percent,  respectively,  below  target.  The  proportion  of   are  enrolled  in  science,  engineering  and  technology
             African students enrolled at these levels is 69.1 and 65.7   qualifications,  while  32  percent  are  enrolled  in  business
             percent,  respectively,  with  an  increase  in  international   or  management  qualifications  and  25  percent  in  other
             student enrolment at Doctoral level.              humanities qualifications, up 6.4 percent from 2020.

             Table 4 provides the enrolment profile according to major

              TABLE 4:
              ENROLMENT PROFILE ACCORDING TO MAJOR FIELD OF STUDY FOR 2021 RELATIVE TO 2019
              AND 2020
                    KEY PERFORMANCE AREA          HEMIS   HEMIS 2020   HEMIS   YEAR ON     2021    ACTUAL
                                                  2019    AUDITED   2021 2ND    YEAR     TARGET    VERSUS
                                                 AUDITED           SUBMISSION  CHANGE              TARGET
                                                                                                  VARIANCE
              Enrolments by major field of study
              Science, Engineering, Technology    11 251   10 358     10 430     0.7%     10 656     -2.1%
              Business/management                 9 036     9 495     9 510      0.2%      9 316     2.1%
              Education                           2 053     2 314     2 255      -2.6%     2 357     -4.3%
              Other humanities                    7 147     7 119     7 572      6.4%      7 457     1.5%
              Distance education enrolments         12       13         16      23.1%       18      -11.1%
              * Key:
              ■ Target met or exceeded
              ■ Trend needs to be monitored
              ■ Target not met and corrective action required
              ■ Data not final and performance indicator will still improve

             The UG enrolments showed a slight shift towards certificate   proportion of Honour’s and Doctoral enrolments in 2021
             and diploma enrolments to 47 percent in 2021, up from 46   relative to the 2020 enrolment profile.
             percent in 2020.  For PG studies, there is an increase in the


                                                   TRANSFORMATION REPORT                                   | 19