
Page 34 - Transformation Report
P. 34
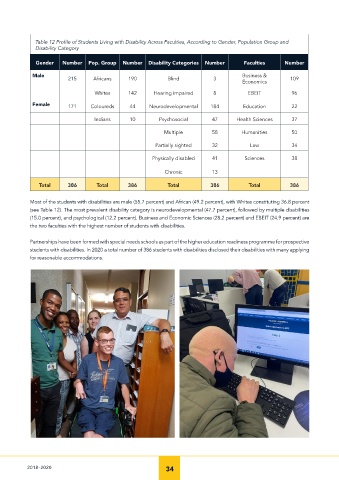
Table 12 Profile of Students Living with Disability Across Faculties, According to Gender, Population Group and
              Disability Category

              Gender   Number   Pop. Group  Number   Disability Categories  Number     Faculties     Number

            Male                                                                      Business &
                         215      Africans    190           Blind           3                          109
                                                                                      Economics
                                  Whites      142      Hearing impaired     8           EBEIT          96
            Female       171     Coloureds     44    Neurodevelopmental    184        Education        22


                                  Indians      10        Psychosocial      47       Health Sciences    37
                                                           Multiple        58         Humanities       50

                                                        Partially sighted  32            Law           34

                                                      Physically disabled  41          Sciences        38

                                                           Chronic         13

               Total     386       Total      386           Total          386          Total                                                386


            Most of the students with disabilities are male (55.7 percent) and African (49.2 percent), with Whites constituting 36.8 percent
            (see Table 12). The most prevalent disability category is neurodevelopmental (47.7 percent), followed by multiple disabilities
            (15.0 percent), and psychological (12.2 percent). Business and Economic Sciences (28.2 percent) and EBEIT (24.9 percent) are
            the two faculties with the highest number of students with disabilities.

            Partnerships have been formed with special needs schools as part of the higher education readiness programme for prospective
            students with disabilities. In 2020 a total number of 386 students with disabilities disclosed their disabilities with many applying
            for reasonable accommodations.


           2018-2020                                       34