Page 30 - Transformation Report
P. 30

2.  Improved Throughput Rates


            The 2014 cohort of first-time entering students were tracked to monitor the profile of students who qualified in the minimum
            time for various qualification types (see Table 11 below).


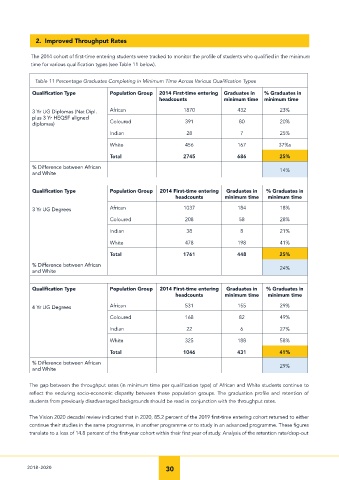
              Table 11 Percentage Graduates Completing in Minimum Time Across Various Qualification Types

            Qualification Type          Population Group  2014 First-time entering  Graduates in   % Graduates in
                                                         headcounts             minimum time  minimum time
                                        African                   1870              432            23%
            3 Yr UG Diplomas (Nat Dipl.
            plus 3 Yr HEQSF aligned
            diplomas)                   Coloured                  391                80            20%

                                        Indian                     28                7             25%
                                        White                     456               167            37%s

                                        Total                    2745               686            25%
            % Difference between African                                                           14%
            and White

            Qualification Type          Population Group  2014 First-time entering   Graduates in   % Graduates in
                                                               headcounts       minimum time   minimum time
                                        African                   1037              184            18%
            3 Yr UG Degrees
                                        Coloured                  208                58            28%

                                        Indian                     38                8             21%
                                        White                     478               198            41%

                                        Total                    1761               448            25%

            % Difference between African                                                           24%
            and White


            Qualification Type          Population Group  2014 First-time entering   Graduates in   % Graduates in
                                                               headcounts       minimum time   minimum time
                                        African                   531               155            29%
            4 Yr UG Degrees
                                        Coloured                  168                82            49%
                                        Indian                     22                6             27%

                                        White                     325               188            58%

                                        Total                    1046               431            41%
            % Difference between African                                                           29%
            and White


           The gap between the throughput rates (in minimum time per qualification type) of African and White students continue to
           reflect the enduring socio-economic disparity between these population groups. The graduation profile and retention of
           students from previously disadvantaged backgrounds should be read in conjunction with the throughput rates.


           The Vision 2020 decadal review indicated that in 2020, 85.2 percent of the 2019 first-time entering cohort returned to either
           continue their studies in the same programme, in another programme or to study in an advanced programme. These figures
           translate to a loss of 14.8 percent of the first-year cohort within their first year of study. Analysis of the retention rate/drop-out


           2018-2020                                       30
   25   26   27   28   29   30   31   32   33   34   35