
Page 21 - Transformation Report
P. 21
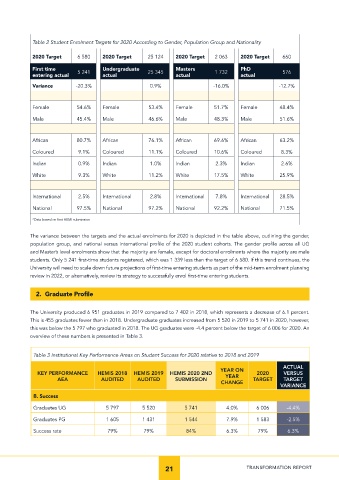
Table 2 Student Enrolment Targets for 2020 According to Gender, Population Group and Nationality

            2020 Target     6 580    2020 Target     25 124    2020 Target  2 063     2020 Target   660

            First time      5 241    Undergraduate   25 345    Masters      1 732     PhD           576
            entering actual          actual                    actual                 actual
            Variance        -20.3%                    0.9%                  -16.0%                 -12.7%


            Female          54.6%    Female          53.4%     Female       51.7%     Female       48.4%
            Male            45.4%    Male            46.6%     Male         48.3%     Male         51.6%


            African         80.7%    African         76.1%     African      69.6%     African      63.2%

            Coloured        9.1%     Coloured        11.1%     Coloured     10.6%     Coloured      8.3%
            Indian          0.9%     Indian           1.0%     Indian        2.3%     Indian        2.6%

            White           9.3%     White           11.2%     White        17.5%     White        25.9%


            International   2.5%     International    2.8%     International  7.8%    International  28.5%

            National        97.5%    National        97.2%     National     92.2%     National     71.5%

            *Data based on first HEMI submission

            The variance between the targets and the actual enrolments for 2020 is depicted in the table above, outlining the gender,
            population group, and national versus international profile of the 2020 student cohorts. The gender profile across all UG
            and Master’s level enrolments show that the majority are female, except for doctoral enrolments where the majority are male
            students. Only 5 241 first-time students registered, which was 1 339 less than the target of 6 580. If this trend continues, the
            University will need to scale down future projections of first-time entering students as part of the mid-term enrolment planning
            review in 2022, or alternatively, review its strategy to successfully enrol first-time entering students.


              2.  Graduate Profile


            The University produced 6 951 graduates in 2019 compared to 7 402 in 2018, which represents a decrease of 6.1 percent.
            This is 455 graduates fewer than in 2018. Undergraduate graduates increased from 5 520 in 2019 to 5 741 in 2020, however,
            this was below the 5 797 who graduated in 2018. The UG graduates were -4.4 percent below the target of 6 006 for 2020. An
            overview of these numbers is presented in Table 3.


             Table 3 Institutional Key Performance Areas on Student Success for 2020 relative to 2018 and 2019

                                                                                                    ACTUAL
                                                                              YEAR ON
              KEY PERFORMANCE      HEMIS 2018  HEMIS 2019  HEMIS 2020 2ND                  2020      VERSUS
                                                                                YEAR
                     AEA             AUDITED     AUDITED       SUBMISSION                 TARGET     TARGET
                                                                               CHANGE
                                                                                                   VARIANCE
             B. Success
             Graduates UG             5 797        5 520          5 741          4.0%      6 006      -4.4%
             Graduates PG             1 605        1 431          1 544          7.9%      1 583      -2.5%

             Success rate              79%          79%           84%            6.3%       79%       6.3%


                                                           21                           TRANSFORMATION REPORT