
Page 23 - Transformation Report
P. 23
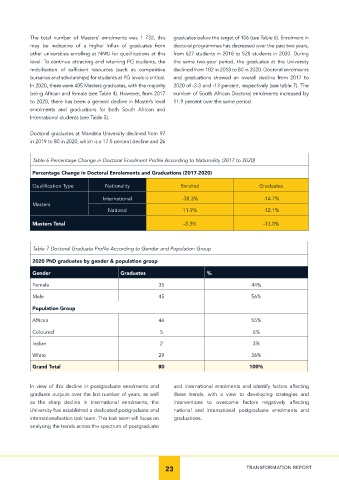
The total number of Masters’ enrolments was 1 732, this   graduates below the target of 106 (see Table 6). Enrolment in
            may  be  indicative  of  a  higher  influx  of  graduates  from   doctoral programmes has decreased over the past two years,
            other universities enrolling at NMU for qualifications at this   from 627 students in 2018 to 528 students in 2020. During
            level. To continue attracting and retaining PG students, the   the same two-year period, the graduates at the University
            mobilisation  of  sufficient  resources  (such  as  competitive   declined from 102 in 2018 to 80 in 2020. Doctoral enrolments
            bursaries and scholarships) for students at PG levels is critical.   and graduations showed an overall decline from 2017 to
            In 2020, there were 405 Masters graduates, with the majority   2020 of -3.3 and -13 percent, respectively (see table 7). The
            being African and female (see Table 4). However, from 2017   number of South African Doctoral enrolments increased by
            to 2020, there has been a general decline in Master’s level   11.9 percent over the same period.
            enrolments and graduations for both South African and
            International students (see Table 5).


            Doctoral graduates at Mandela University declined from 97
            in 2019 to 80 in 2020, which is a 17.5 percent decline and 26


            Table 6 Percentage Change in Doctoral Enrolment Profile According to Nationality (2017 to 2020)


            Percentage Change in Doctoral Enrolements and Graduations (2017-2020)
            Qualification Type        Nationality               Enrolled                    Graduates

                                     International               -38.3%                      -14.7%
            Masters
                                       National                  11.9%                       -12.1%


            Masters Total                                        -3.3%                       -13.0%


            Table 7 Doctoral Graduate Profile According to Gender and Population Group

            2020 PhD graduates by gender & population group
            Gender                         Graduates                      %

            Female                                       35                              44%
            Male                                         45                              56%

            Population Group

            African                                      44                              55%
            Coloured                                     5                                6%

            Indian                                       2                                3%
            White                                        29                              36%

            Grand Total                                  80                              100%


            In view of this decline in postgraduate enrolments and   and international enrolments and identify factors affecting
            graduate outputs over the last number of years, as well   these trends, with a view to developing strategies and
            as the sharp decline in international enrolments, the   interventions to overcome  factors negatively  affecting
            University has established a dedicated postgraduate and   national and international postgraduate enrolments and
            internationalisation task team. This task team will focus on   graduations.
            analysing the trends across the spectrum of postgraduate


                                                           23                           TRANSFORMATION REPORT