
Page 46 - Transformation Report 2021
P. 46
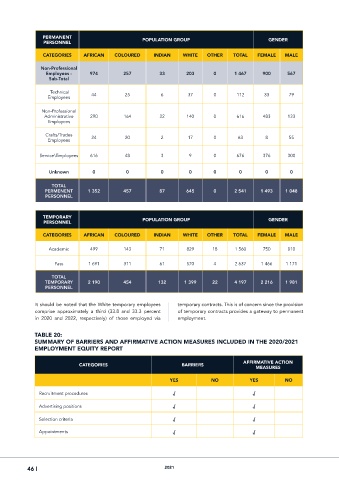
PERMANENT
                PERSONNEL                          POPULATION GROUP                            GENDER

                CATEGORIES    AFRICAN    COLOURED      INDIAN    WHITE    OTHER    TOTAL   FEMALE    MALE

               Non-Professional
                 Employees -     974        257          33       203       0      1 467     900      567
                  Sub-Total

                   Technical     44          25           6        37       0       112       33      79
                  Employees

                Non-Professional
                 Administrative   290       164          22        140      0       616      483      133
                  Employees

                 Crafts/Trades   24          20           2        17       0        63       8       55
                  Employees


               Service\Employees  616        48           3        9        0       676      376      300

                  Unknown         0          0            0        0        0        0        0        0

                   TOTAL
                 PERMENENT      1 352       457          87       645       0      2 541     1 493   1 048
                 PERSONNEL


                TEMPORARY                          POPULATION GROUP                            GENDER
                PERSONNEL

                CATEGORIES    AFRICAN    COLOURED      INDIAN    WHITE    OTHER    TOTAL   FEMALE    MALE

                  Academic       499        143          71        829      18     1 560     750      810

                    Pass        1 691       311          61        570      4      2 637     1 466   1 171

                   TOTAL
                 TEMPORARY      2 190       454          132      1 399     22     4 197     2 216   1 981
                 PERSONNEL

             It should be noted that the White temporary employees   temporary contracts. This is of concern since the provision
             comprise  approximately  a  third  (33.8  and  33.3  percent   of temporary contracts provides a gateway to permanent
             in  2020  and  2022,  respectively)  of  those  employed  via   employment.


             TABLE 20:
             SUMMARY OF BARRIERS AND AFFIRMATIVE ACTION MEASURES INCLUDED IN THE 2020/2021
             EMPLOYMENT EQUITY REPORT

                                                                                      AFFIRMATIVE ACTION
                             CATEGORIES                          BARRIERS
                                                                                           MEASURES
                                                             YES           NO            YES         NO

               Recruitment procedures                         √                           √
               Advertising positions                          √                           √

               Selection criteria                             √                           √

               Appointments                                   √                           √


           46 |                                            2021