
Page 56 - Transformation Report 2021
P. 56
6.1.1. Energy The rollout of the generator installations on all campuses
Since the start of load shedding in 2008, the University was planned in 4-phases and to run from 2019 to 2022.
has installed generators to support critical functions The total capital expenditures for all 4 phases will be R12
across all campuses. This has since been complemented 118 109.21 with an annual maintenance budget of R726
by the construction of the photovoltaic solar farm on 000.
Summerstrand South Campus. The University’s renewable
energy strategy envisions photovoltaic systems installed After the successful installation of the 1MV South campus
on all campuses at a projected total cost of R66-million. solar farm, it was decided to design an overall institutional
The capital outlay will yield significant savings on the renewable energy strategy. The rollout of this overall
University’s electricity bill with a payback period of about strategy, which will see photovoltaic systems installed on
5.5 years. The process of installing the Missionvale Campus all campuses at a projected total cost of R66m, will be
solar farm has commenced. The installation, estimated at a realised through a 5-year implementation plan. The capital
cost of R4 million, is planned for 2022 and will be funded outlay will yield significant savings on the university’s
from the five-year maintenance budget. electricity bill with a payback period of about 5.5 years.
Since the start of load shedding in 2008, the University The process to install the Missionvale Campus solar farm,
responded by installing generators in all critical functions which was approved, and the design and consultation work
across the campuses. As the energy crisis worsened, paid for through the R1,5m DHET grant has commenced.
the plan was extended to cover all buildings. This has The installation, estimated at a cost of R4m, is planned
since been complemented with the development and for 2022 and will be funded from the 5-year maintenance
implementation of plans to install photovoltaic solar farms budget.
on the different campuses in pursuit of the institutional
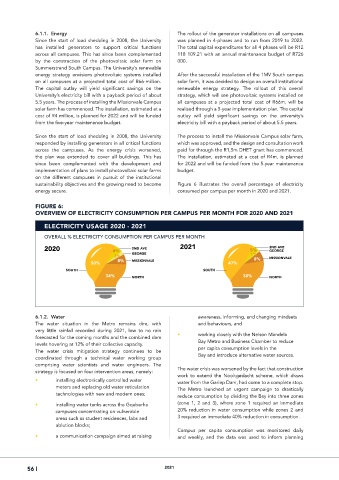
sustainability objectives and the growing need to become Figure 6 illustrates the overall percentage of electricity
energy secure. consumed per campus per month in 2020 and 2021.
FIGURE 6:
OVERVIEW OF ELECTRICITY CONSUMPTION PER CAMPUS PER MONTH FOR 2020 AND 2021
ELECTRICITY USAGE 2020 - 2021
OVERALL % ELECTRICITY CONSUMPTION PER CAMPUS PER MONTH
2020 6% 2ND AVE 2021 5% 2ND AVE
GEORGE
GEORGE 1%
3% MISSIONVALE
8% MISSIONVALE 8%
50% 47%
SOUTH SOUTH
34% NORTH 38% NORTH
WATER USAGE 2019 - 2020
6.1.2. Water awareness, informing, and changing mindsets
OVERALL % WATER CONSUMPTION PER CAMPUS PER MONTH
The water situation in the Metro remains dire, with and behaviours, and
very little rainfall recorded during 2021, low to no rain
2020 • 2021 working closely with the Nelson Mandela
forecasted for the coming months and the combined dam
Bay Metro and Business Chamber to reduce
levels hovering at 12% of their collective capacity.
per capita consumption levels in the
The water crisis mitigation strategy continues to be
73%
2ND AVE
58% 1% 2ND AVE Bay and introduce alternative water sources.
1%
coordinated through a technical water working group
12% GEORGE 63%
comprising water scientists and water engineers. The SOUTH 21% GEORGE
63%
SOUTH
The water crisis was worsened by the fact that construction
13%
strategy is focused on four intervention areas, namely: MISSIONVALE
MISSIONVALE
3%
work to extend the Nooitgedacht scheme, which draws
17%
2%
• installing electronically controlled water water from the Gariep Dam, had come to a complete stop.
NORTH
NORTH
meters and replacing old water reticulation
The Metro launched an urgent campaign to drastically
technologies with new and modern ones;
reduce consumption by dividing the Bay into three zones
• installing water tanks across the Gqeberha (zone 1, 2 and 3), where zone 1 required an immediate
campuses concentrating on vulnerable 20% reduction in water consumption while zones 2 and
areas such as student residences, labs and 3 required an immediate 40% reduction in consumption.
ablution blocks;
Campus per capita consumption was monitored daily
• a communication campaign aimed at raising and weekly, and the data was used to inform planning
56 | 2021