
Page 58 - Transformation Report 2021
P. 58
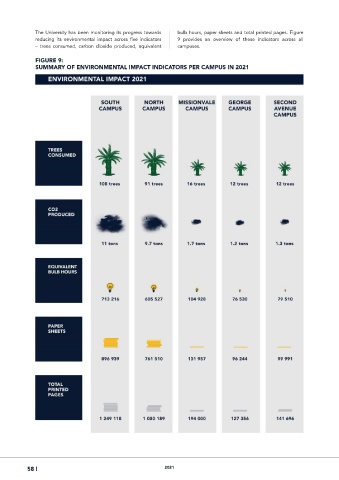
The University has been monitoring its progress towards   bulb hours, paper sheets and total printed pages. Figure
             reducing  its  environmental  impact  across  five  indicators   9  provides  an  overview  of  these  indicators  across  all
             –  trees  consumed,  carbon  dioxide  produced,  equivalent   campuses.

             FIGURE 9:
             SUMMARY OF ENVIRONMENTAL IMPACT INDICATORS PER CAMPUS IN 2021


           58 |                                            2021