
Page 57 - Transformation Report 2021
P. 57
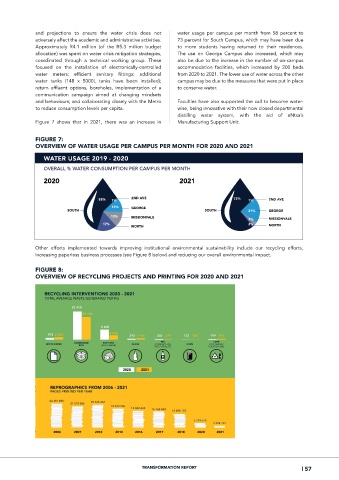
and  projections  to  ensure  the  water  crisis  does  not   water usage per campus per month from 58 percent to
             adversely affect the academic and administrative activities.   73 percent for South Campus, which may have been due
             Approximately  R4.1  million  (of  the  R5.3  million  budget   to  more  students  having  returned  to  their  residences.
             allocation) was spent on water crisis mitigation strategies,   The  use  on  George  Campus  also  increased,  which  may
             coordinated  through  a  technical  working  group.  These   also be due to the increase in the number of on-campus
             focused  on  the  installation  of  electronically-controlled   accommodation  facilities,  which  increased  by  200  beds
                ELECTRICITY USAGE 2020 - 2021
             water  meters;  efficient  sanitary  fittings;  additional   from 2020 to 2021. The lower use of water across the other
             water  tanks  (148  x  5000L  tanks  have  been  installed);   campus may be due to the measures that were put in place
                OVERALL % ELECTRICITY CONSUMPTION PER CAMPUS PER MONTH
             return  effluent  options,  boreholes,  implementation  of  a   to conserve water.
                2020
             communication  campaign  aimed  at  changing  mindsets   2021               5%    2ND AVE
                                               2ND AVE
                                        6%
                                                                                               GEORGE
                                               GEORGE
                                                                                         1%
             and behaviours; and collaborating closely with the Metro   Faculties have also supported the call to become water-
                                         3%
                                                                                               MISSIONVALE
                                                                                          8%
                                          8%
             to reduce consumption levels per capita.   MISSIONVALE  wise, being innovative with their now closed departmental
                                 50%
                                                                                 47%
                        SOUTH                                  distilling  water  system,  with  the  aid  of  eNtsa’s
                                                                        SOUTH
             Figure  7  shows  that  in  2021,  there  was  an  increase  in   Manufacturing Support Unit. 38%  NORTH
                                      34%
                                               NORTH
             FIGURE 7:
             OVERVIEW OF WATER USAGE PER CAMPUS PER MONTH FOR 2020 AND 2021
                WATER USAGE 2019 - 2020
                OVERALL % WATER CONSUMPTION PER CAMPUS PER MONTH
                2020                                            2021
                                    58%  1%    2ND AVE                             73%  1%     2ND AVE
                                        12%    GEORGE                             63%
                                 63%
                         SOUTH                                           SOUTH          21%    GEORGE
                                        13%    MISSIONVALE
                                                                                        3%     MISSIONVALE
                                     17%                                                2%     NORTH
                                               NORTH
             Other  efforts  implemented  towards  improving  institutional  environmental  sustainability  include  our  recycling  efforts,
             increasing paperless business processes (see Figure 8 below) and reducing our overall environmental impact.


             FIGURE 8:
             OVERVIEW OF RECYCLING PROJECTS AND PRINTING FOR 2020 AND 2021


                                                   TRANSFORMATION REPORT                                   | 57