
Page 53 - Transformation Report 2021
P. 53
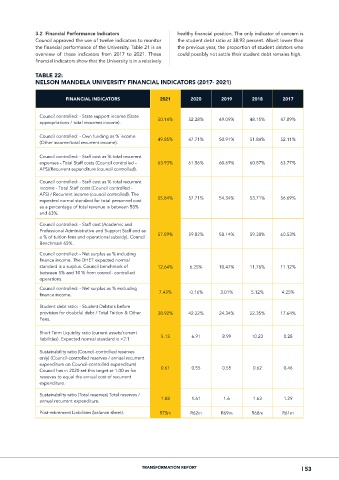
3.2  Financial Performance Indicators             healthy financial position. The only indicator of concern is
             Council approved the use of twelve indicators to monitor   the student debt ratio at 38.92 percent. Albeit lower than
             the financial performance of the University. Table 21 is an   the previous year, the proportion of student debtors who
             overview  of  these  indicators  from  2017  to  2021.  These   could possibly not settle their student debt remains high.
             financial indicators show that the University is in a relatively

             TABLE 22:
             NELSON MANDELA UNIVERSITY FINANCIAL INDICATORS (2017- 2021)

                        FINANCIAL INDICATORS             2021       2020       2019       2018      2017


               Council controlled: - State support income (State   50.14%  52.28%  49.09%  48.15%   47.89%
               appropriations / total recurrent income).

               Council controlled: - Own funding as % income
               (Other income/total recurrent income).   49.85%     47.71%     50.91%     51.84%     52.11%

               Council controlled: - Staff cost as % total recurrent
               expenses - Total Staff costs (Council controlled -   63.93%  61.56%  60.69%  60.87%  63.77%
               AFS)/Recurrent expenditure (council controlled).

               Council controlled: - Staff cost as % total recurrent
               income - Total Staff costs (Council controlled -
               AFS) / Recurrent income (council controlled). The
               expected normal standard for total personnel cost   55.84%  57.71%  54.34%  53.71%   56.69%
               as a percentage of total revenue is between 58%
               and 63%.

               Council controlled: - Staff cost (Academic and
               Professional Administrative and Support Staff and as
               a % of tuition fees and operational subsidy). Council   57.89%  59.82%  58.14%  59.38%  60.53%
               Benchmark 65%.
               Council controlled: - Net surplus as % including
               finance income. The DHET expected normal
               standard is a surplus. Council benchmark of   12.64%  6.25%    10.47%     11.76%     11.12%
               between 5% and 10 % from council- controlled
               operations.

               Council controlled: - Net surplus as % excluding
               finance income.                           7.43%     -0.16%     3.01%      5.12%      4.25%

               Student debt ratio: - Student Debtors before
               provision for doubtful debt / Total Tuition & Other   38.92%  42.22%  24.34%  22.35%  17.64%
               Fees.

               Short Term Liquidity ratio (current assets/current
               liabilities). Expected normal standard is >2:1  5.13  6.91      8.99      10.23       8.28
               Sustainability ratio (Council-controlled reserves
               only) (Council-controlled reserves / annual recurrent
               expenditure on Council-controlled expenditure)
               Council has in 2020 set this target at 1.00 as for   0.61  0.55  0.55      0.62       0.46
               resreves to equal the annual cost of recurrent
               expenditure.

               Sustainability ratio (Total reserves) Total reserves /
               annual recurrent expenditure.              1.88      1.61        1.6       1.63       1.29

               Post-retirement Liabilities (balance sheet).  R75m   R62m       R69m      R68m       R61m


                                                   TRANSFORMATION REPORT                                   | 53